
Prometheus Blog Series (Part 3): Exposing and collecting metrics
In Part 1 and Part 2 of this series, we covered the basics of Prometheus metrics and labels. This third part will concentrate on the way Prometheus collects metrics and how clients expose them.
Push vs Pull
Metrics collection with Prometheus relies on the pull model, meaning that Prometheus is responsible for getting metrics (scraping) from the services that it monitors. This is diametrically opposed from other tools like Graphite, which are passively waiting on clients to push their metrics to a known server.
Moving this responsibility to the server relieves the clients from a lot of the workload. Instrumented services only have to expose metrics in a way a Prometheus server can read them and doesn’t need to worry about where the Prometheus server is (or if there is any at all). Additionally, instrumenting a service is relatively cheap on the client side, as Prometheus does all the heavy lifting for complex calculations (see Histograms mentioned in Part 2). Finally, if the Prometheus server was ever under pressure, it will throttle the scraping of services itself, as opposed to having clients pushing metrics and bringing down the server.
A potential challenge with this model is that Prometheus now needs to know where to collect these metrics. In a microservices architecture, services can be short-lived and their number of instances can vary over time, which means that static configuration is not an option. Fortunately, Prometheus server comes with built-in service discovery solutions and makes it pretty seamless to integrate with a number of platforms and tools, including Kubernetes and Consul.
Exposing and scraping metrics
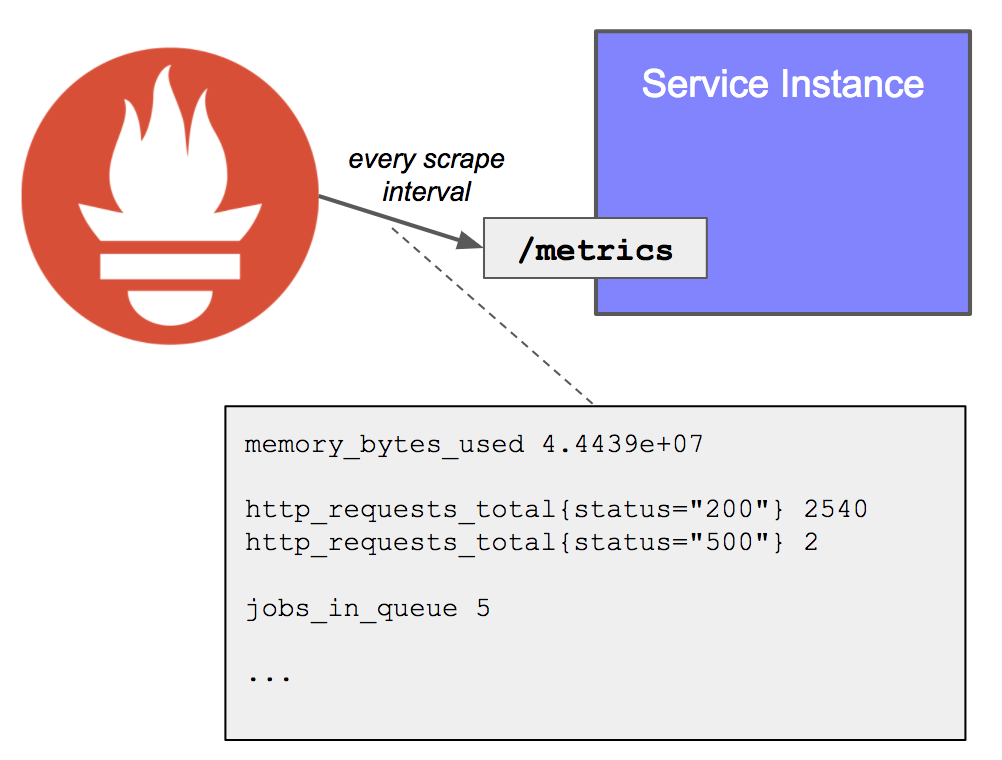
Clients have only one responsibility: make their metrics available for a Prometheus server to scrape. This is done by exposing an HTTP endpoint, usually /metrics, which returns the full list of metrics (with label sets) and their values. This endpoint is very cheap to call as it simply outputs the current value of each metric, without doing any calculation.
Most languages have some implementation of the Prometheus client, which comes with:
- Built-in metrics for the language (e.g. JVM metrics, Go metrics)
- The ability to registry custom metrics
- Some HTTP handler to create the
/metricsendpoint
On the Prometheus server side, each target (statically defined, or dynamically discovered) is scraped at a regular interval (scrape interval). Each scrape reads the /metrics to get the current state of the client metrics, and persists the values in the Prometheus time-series database.
In addition to the collected metrics, Prometheus will create an additional one called up, which will be set to 1 if the last scrape is successful, or 0 otherwise. The up metric is incredibly useful to detect crashes.
Exporters: Instrumenting machines and third-party appliances
Not everything can be instrumented at the code level. This is where exporters come useful, acting as side-cars to machines or other applications (e.g. databases).
The most common one is the node exporter, which can be installed on every machine to read system level metrics (cpu, memory, file system…) and expose them under a /metrics endpoint in the way Prometheus can scrape it.
Other exporters are listed on the Prometheus documentation
The big picture
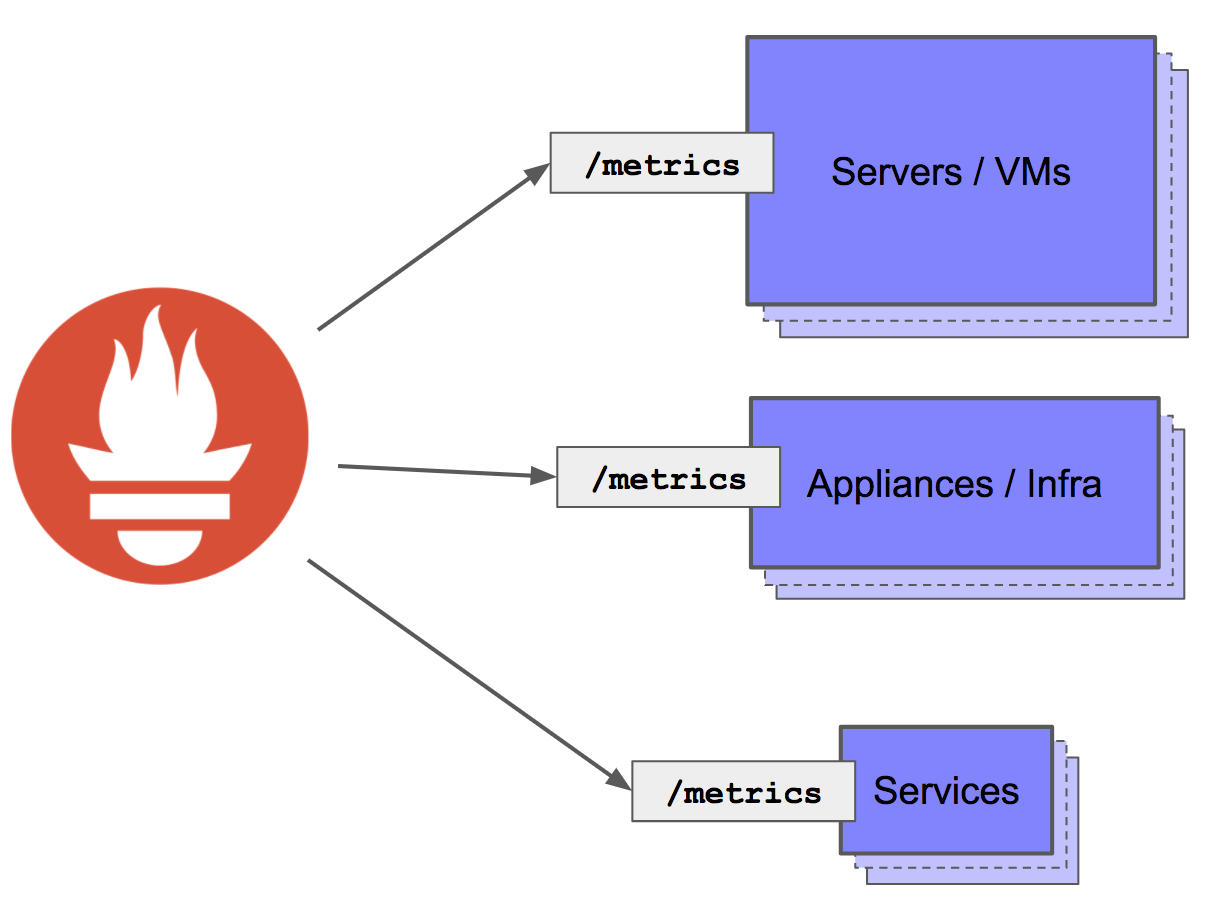
Combining client libraries, node exporters and application-specific exporters, Prometheus can gather metrics from services, infrastructure and third-party appliances:
What’s next?
The key of any monitoring tool is its simplicity, especially when it comes to instrumentation. Prometheus shines in that area, making it very easy for clients to expose built-in metrics without having to worry about the Prometheus server (so long as best practices are being followed in terms of label cardinality!). However, built-in metrics only get us some part of the way to observe systems; in the next part, we will be looking at how to instrument Golang and Java applications to add custom metrics.
If there is any specific subject you would like me to cover in this series, feel free to reach out to me on Twitter at @PierreVincent
Looking to get more practical training with Prometheus?
I am regularly teaching workshops on Cloud Native monitoring with Prometheus & Grafana - don’t hesitate to get in touch with me (speaking@pvincent.io) for more info about running a workshop for your team or at your meetup/conference.